(★ Friends: The costs for services to support this site continue to come in, so please donate here if you would like to assist. Your help is so very much appreciated. ★)
(For our Highlights of the weekend’s major competitions, click here)
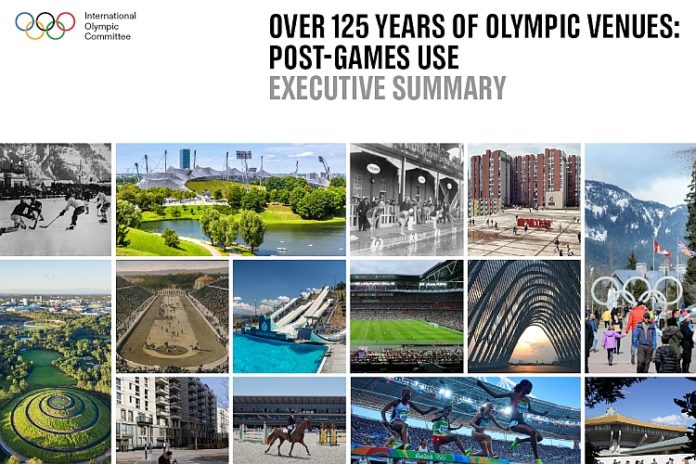
April’s Olympic Studies Centre report, Over 125 years of Olympic venues: post-Games use, provided a fascinating snapshot of what has happened to the hundreds of sites used for Olympic competitions from Athens 1896 to the PyeongChang Winter Games in 2018.
Our look at the Olympic Games data showed that the majority of venues were still in use today and overwhelmingly so in the 21st Century. But what about the Winter Games sites? Time to take a look at those, with the number of competition venues, the percentage of existing and new competition sites (not temporary) and the percentage of those still in use:
● 1924 Chamonix [3]: Existing & new: 67% ~ Still in use: 100%
● 1928 St. Moritz [5]: Existing & new: 60% ~ Still in use: 33%
● 1932 Lake Placid [6]: Existing & new: 83% ~ Still in use: 100%
● 1936 Garmisch [6]: Existing & new: 67% ~ Still in use: 100%
● 1948 St. Moritz [8]: Existing & new: 75% ~ Still in use: 100%
● 1952 Oslo [11]: Existing & new: 91% ~ Still in use: 90%
● 1956 Cortina [8]: Existing & new: 75% ~ Still in use: 67%
● 1960 “Palisades Tahoe” [6]: Existing & new: 57% ~ Still in use: 50%
=> (Site known as Squaw Valley at the time, but recently renamed)
● 1964 Innsbruck [9]: Existing & new: 100% ~ Still in use: 100%
● 1968 Grenoble [9]: Existing & new: 89% ~ Still in use: 78%
● 1972 Sapporo [13]: Existing & new: 85% ~ Still in use: 69%
● 1976 Innsbruck [9]: Existing & new: 100% ~ Still in use: 100%
● 1980 Lake Placid [7] : Existing & new: 100% ~ Still in use: 100%
● 1984 Sarajevo [8]: Existing & new: 88% ~ Still in use: 75%
● 1988 Calgary [10]: Existing & new: 100% ~ Still in use: 70%
● 1992 Albertville [10]: Existing & new: 100% ~ Still in use: 100%
● 1994 Lillehammer [10]: Existing & new: 100% ~ Still in use: 100%
● 1998 Nagano [14]: Existing & new: 100% ~ Still in use: 79%
● 2002 Salt Lake City [10]: Existing & new: 100% ~ Still in use: 100%
● 2006 Turin [13]: Existing & new: 92% ~ Still in use: 92%
● 2010 Vancouver [9]: Existing & new: 100% ~ Still in use: 100%
● 2014 Sochi [10]: Existing & new: 100% ~ Still in use: 100%
● 2018 PyeongChang [12]: Existing & new: 100% ~ Still in use: 92%
That’s 23 Winter Games and 12 have all of their existing and new-construction competition sites still in use today and two at 90% or more. Another three have 75% still in use, so that’s 17 of 23 (74%) that have at least three-quarters of their competition venues still active. That’s pretty good.
That’s a bit better than for the Olympic Games sites; of the 28 Games from 1896-2016, 19 have 75% or better current use of their competition sites, or 68%.
It’s also worth noting that relatively small number of competition sites at all of the Winter Games. The largest number of sites was in Nagano in 1998, with 14. Even as recently as 2010, Vancouver had only nine competition venues.
Who built the most? Here are the Winter Games sites ranked by the percentage of venues constructed new for their Games:
1. 90% ~ Lillehammer 1994 (9)
1. 90% ~ Sochi 2014 (9)
3. 89% ~ Grenoble 1968 (8)
3. 89% ~ Innsbruck 1976 (8)
5. 88% ~ Sarajevo 1984 (7)
6. 83% ~ Lake Placid 1932 (5)
7. 77% ~ Sapporo 1972 (10)
8. 70% ~ Calgary 1988 (7)
9. 67% ~ Chamonix 1924 (2)
9. 67% ~ Garmisch-Partenkirchen 1936 (4)
9. 67% ~ Vancouver 2010 (6)
12. 60% ~ Albertville 1992 (6)
13. 57% ~ Lake Placid 1980 (4)
14. 56% ~ Innsbruck 1964 (4)
15. 50% ~ Palisades Tahoe 1960 (4)
15. 50% ~ Nagano 1998 (7)
17. 50% ~ PyeongChang 2018 (6)
18. 46% ~ Turin 2006 (6)
19. 40% ~ St. Moritz 1928 (2)
19. 40% ~ Salt Lake City 2002 (4)
21. 13% ~ Cortina 1956 (1)
22. 9% ~ Oslo 1952 (1)
23. 0% ~ St. Moritz 1948 (0)
And the recycling champions, for the use of existing venues:
1. 82% ~ Oslo 1952 (9)
2. 75% ~ St. Moritz 1948 (6)
3. 63% ~ Cortina 1956 (5)
4. 60% ~ Salt Lake City 2002 (6)
5. 50% ~ Nagano 1998 (7)
5. 50% ~ PyeongChang 2018 (6)
7. 46% ~ Turin 2006 (6)
8. 44% ~ Innsbruck 1964 (4)
9. 43% ~ Lake Placid 1980 (3)
10. 40% ~ Albertville 1992 (4)
11. 33% ~ St. Moritz 1928 (1)
11. 33% ~ Vancouver 2010 (3)
13. 30% ~ Calgary 1988 (3)
14. 17% ~ Lake Placid 1932 (1)
15. 12% ~ Sarajevo 1984 (1)
16. 11% ~ Grenoble 1968 (1)
16. 11% ~ Innsbruck 1976 (1)
18. 10% ~ Lillehammer 1994 (1)
18. 10% ~ Sochi 2014 (1)
20. 8% ~ Sapporo 1972 (1)
21. 0% ~ Chamonix 1924 (0)
21. 0% ~ Garmisch-Partenkirchen 1936 (0)
21. 0% ~ Palisades Tahoe 1960 (0)
It’s worth noting that the Salt Lake City (USA) bid team for 2030 is proposing no new venues, but re-use of the existing sites from the 2002 Games, even with 36 more events on the program for 2026!
(Some of these percentages do not correspond to the graphics shown in the study, which were incorrect for several Games; the above figures are in line with the written description of each Games in the study.)
What does this tell us about the Winter Games? That these events are often the springboard to the development of ski and winter-sport resorts, with the public after-use often planned well in advance. This was certainly the case in Nagano in 1998 and Sochi in 2014, for example, but also for existing winter-sport destinations like Grenoble in 1968 and Innsbruck in 1976.
The Winter Games is not as big or complex as the Olympic Games and given the conditions in which they are held, that’s a good thing. Given the excellent re-use history of the Winter Games section documented in the IOC’s survey, perhaps the summer Games would benefit from going on a sport-and-venue diet as well.
Rich Perelman
Editor
You can receive our exclusive TSX Report by e-mail by clicking here. You can also refer a friend by clicking here, and can donate here to keep this site going.
For our updated, 620-event International Sports Calendar for 2022 and beyond, by date and by sport, click here!


